By LCN Business Desk
A firm in Georgetown writing next year's wage offer, or a rent review clause, or a price-adjustment term into a supply contract, needs one number.
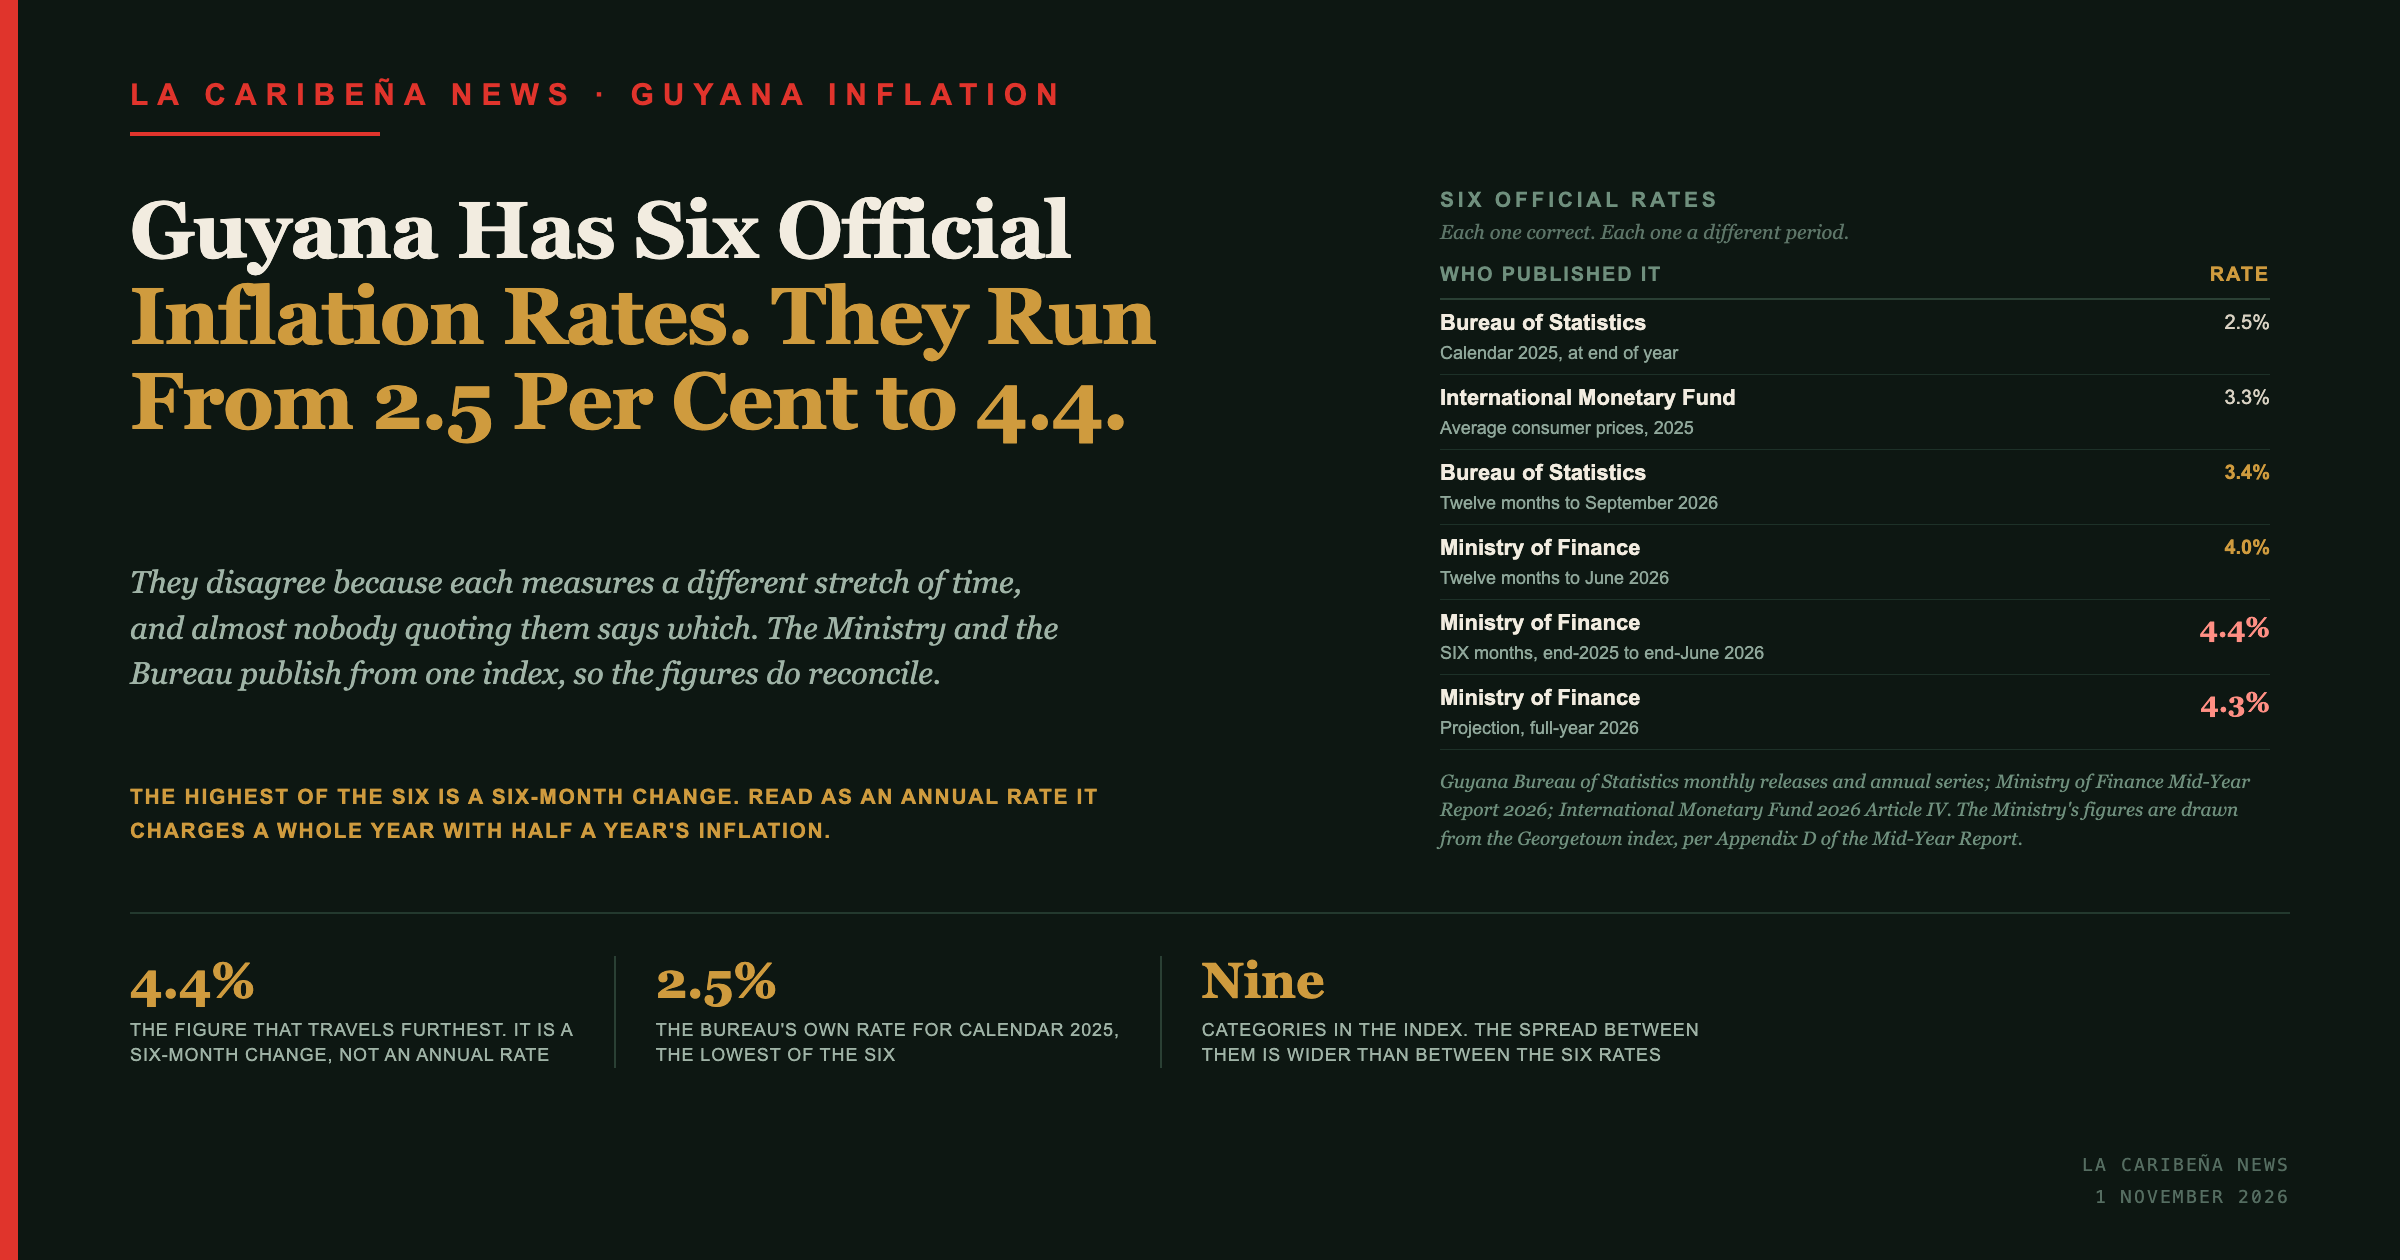
There are at least six in circulation, every one of them official, and the highest is nearly double the lowest. They disagree because each measures a different stretch of time, and almost nobody quoting them says which.
What are the six figures?
Four measurements and two projections, from three institutions.
| What was measured | Over what period | Rate | Stated by |
|---|---|---|---|
| Georgetown index, all items | calendar 2024, recorded at end of year | 2.9% | Bureau of Statistics |
| Average consumer prices | calendar 2024 | 2.9% | IMF, 2026 Article IV |
| Georgetown index, all items | calendar 2025, recorded at end of year | 2.5% | Bureau of Statistics |
| Average consumer prices | calendar 2025 | 3.3% | IMF, 2026 Article IV |
| Consumer prices | 12 months to June 2025 | 4.2% | Ministry of Finance |
| Consumer prices | end-2025 to end-June 2026, six months | 4.4% | Ministry of Finance |
| Consumer prices | 12 months to June 2026 | 4.0% | Ministry of Finance |
| Georgetown index, all items | 12 months to September 2026 | 3.4% | Bureau of Statistics |
| Georgetown index, all items | 12-month average to September 2026 | 3.4% | Bureau of Statistics |
| Food, Georgetown | 12 months to September 2026 | 3.8% | Bureau of Statistics |
| Food | end-2025 to end-June 2026, six months | 6.7% | Ministry of Finance |
| Full year 2026 | projection | 4.3% | Ministry of Finance |
| Full year 2026 | projection | 4.1% | IMF, 2026 Article IV |
| Around 2028 | projection | about 5% | World Bank, cited by Gampat |
*The Ministry's figures are drawn from the Georgetown index. The 4.1 per cent projection is from the Article IV consultation reported by LCN.*
Are they measuring different things?
Mostly no. The Ministry and the Bureau publish from one index, which is checkable.
Appendix D of the Ministry of Finance's Mid-Year Report 2026 is titled "Mid-Year Consumer Price Index" and sourced to the Guyana Bureau of Statistics. Its December 2025 column reads 147.05 for all items, 222.32 for food and 97.92 for housing, across the same nine categories as the Bureau's own release. The Ministry is not publishing a separate national index. It is publishing the Georgetown one. LCN has reported the growth figures from the same document, in which the forecast for everything except oil was cut.
So the figures are comparable, and the arithmetic reconciles against the published index levels.
| The published rate | The levels behind it | What the arithmetic gives |
|---|---|---|
| Ministry, 4.4%, six months to end-June 2026 | 147.05 to 153.47 | +4.37% |
| Ministry, 4.0%, twelve months to June 2026 | 147.60 to 153.47 | +3.98% |
| Bureau, 3.4%, twelve months to September 2026 | 148.20 to 153.19 | +3.37% |
| Bureau, 2.5%, calendar 2025 | 143.51 to 147.05 | +2.47% |
*LCN calculations from index levels published by the Bureau of Statistics and in Appendix D of the Mid-Year Report.*
The one figure that looks like an error is not one. The twelve-month rate fell from 4.0 per cent in June to 3.4 per cent in September because both ends moved against it: the 2026 index slipped over the third quarter while the year-earlier base rose over the same months of 2025.
The two annual figures for 2024 agree exactly, and for 2025 they diverge, with the Fund's the higher of the pair. The Bureau records its rate at the end of the year and the Fund describes its own as an average, which would account for a gap, though neither publishes enough to confirm that it is this gap. Ramesh Gampat, a former economist at the United Nations Development Programme, puts the official 2025 measure at an average of 3.5 per cent in an October paper, higher than both.
Which one should a business actually use?
The one whose period matches the contract, and for many firms none of them is the right index at all.
The highest of the six is a six-month movement, stated as such in the report that produced it, so quoting it as an annual rate charges a whole year with half a year's inflation. The twelve-month readings are lower, and the most recent is the lowest of them.
The practical test is whether a firm's own cost base resembles the basket. A supermarket, a caterer or a school canteen sits close to the food line, which runs above the headline on every measure in the table. A haulier or a distributor sits closer to transport, which outpaced the headline over the past year. A business whose largest controllable costs are commercial rent, land or building materials has no published index that tracks them, and the nearest official category is a housing line LCN has reported has not moved since 2009, against which the IMF has asked three times for better real estate statistics.
Three practices remove the ambiguity from a clause.
- Name the period in the clause. "Twelve-month point-to-point change in the Georgetown Consumer Price Index, all items, as published by the Bureau of Statistics" is unambiguous. "Inflation" is not.
- Never index a contract to a projection. Two of the six are forecasts, and the Ministry's has already been revised upward once this year.
- Check the category, not the headline. The index publishes nine of them, and the spread between the fastest and the slowest is far wider than the spread between the six headline figures.
Why can a reader not simply verify the number?
Because the weights are not published, so the index can be read but not rebuilt.
The Bureau publishes index levels and rates. It does not publish the weight of any category, what sits inside any category, or any methodology document. LCN has reported that the basket itself comes from a survey completed in 2006, that the survey meant to replace it finished field work in November 2019, and that the International Monetary Fund graded the country's price statistics C and found progress on its recommendation slow, in a consultation LCN reported was signed off without meeting to discuss it.
That bears directly on the table above. Without weights there is no way to say how much of any one of those six figures is food, and no way to test any of them against a firm's own costs. The figures can be checked against each other, and the construction behind them cannot be checked at all.
The six rates are not a scandal and they are not interchangeable. They are six correct answers to six different questions, published without the questions attached.
The entities
- Guyana Bureau of Statistics is the national statistical office, which compiles and publishes the Georgetown Consumer Price Index.
- Georgetown Consumer Price Index is Guyana's headline price measure, set to 100 at December 2009, with nine categories.
- Ministry of Finance publishes Guyana's Mid-Year Report, whose Appendix D carries the Consumer Price Index table and whose text carries the half-year figures and the full-year projection.
- International Monetary Fund (IMF) publishes average consumer price inflation for Guyana through its Article IV consultations.
- World Bank is the source, cited in an October 2026 paper by the economist Ramesh Gampat, of a projection that inflation reaches around 5 per cent by 2028.
- Ramesh Gampat is a former economist at the United Nations Development Programme and the author of that paper.
What the title card says
- Headline: Guyana has six official inflation rates, running from 2.5 per cent to 4.4 per cent.
- Bureau of Statistics, calendar 2025, recorded at end of year: 2.5 per cent.
- IMF, average consumer prices, calendar 2025: 3.3 per cent.
- Bureau of Statistics, twelve months to September 2026: 3.4 per cent.
- Ministry of Finance, twelve months to June 2026: 4.0 per cent.
- Ministry of Finance, end-2025 to end-June 2026, a six-month change: 4.4 per cent.
- Ministry of Finance, full-year 2026 projection: 4.3 per cent.
- The Ministry's figures are drawn from the Georgetown index, per Appendix D of the Mid-Year Report 2026.
Frequently Asked Questions
What is Guyana's inflation rate?
It depends on the period. The Bureau of Statistics recorded 2.5 per cent for calendar 2025 and 3.4 per cent over the twelve months to September 2026. The Ministry of Finance published 4.4 per cent for the first half of 2026, 4.0 per cent for the twelve months to June, and projects 4.3 per cent for the full year.
Why is the 4.4 per cent figure so much higher?
Because it is a six-month change, measured from the end of 2025 to the end of June 2026, and the Mid-Year Report states it as such. Read as an annual rate it attributes a full year's inflation to half a year.
Do the Ministry of Finance and the Bureau of Statistics use different indices?
No. Appendix D of the Mid-Year Report 2026 reproduces the Georgetown index, with the same nine categories and the same levels, including 147.05 for all items at December 2025.
Which inflation figure should go into a commercial contract?
Name the series, the measure and the period in the clause rather than writing "inflation", and do not index to a projection. Where a firm's main costs are rent, land or building materials, no published Guyanese index tracks them, and the headline rate will understate or overstate depending on the category.